
Editor’s note: This is the bonus page for “An element(ary) building block analysis”, found here.
Generally, we can identify three questions about the block distribution, and we can identify a way to assess each one in a quantitative fashion.
Question 1: How are numbers grouped into blocks (i.e., sets of six)?
Ignoring colors for the time being, just suppose you were designing this block set from scratch, and you didn’t know any chemistry. The two simplest ways to systematically organize 118 numbers on 20 cubes are:
(A.) First block has 1-6, second block has 7-12, etc.
(B.) First block has 1, 21, 41, 61, 81, 101. Second block has 2, 22, etc.
By looking at the average and standard deviation of the six numbers on each block, we can get a qualitative measure of how “spread out” the numbers on each block are in each of these cases:
- In arrangement A, each block has the smallest possible standard deviation (1.9). The average of the six numbers on each block start at 3.5 for the first block and go up to to 116.5 for the last block.
- In arrangement B, each block has a standard deviation of about 37, and the averages are all pretty close to one another (ranging, for example, from 51-68) — the exact details depend on where one decides to place the two “blank” sides.
The actual distribution of numbers looks more like arrangement B, with large standard deviations and averages near the middle of the range:
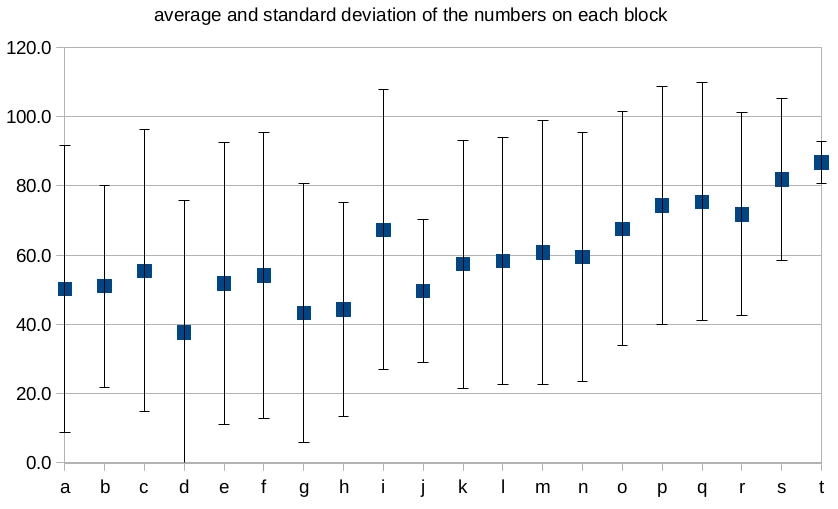
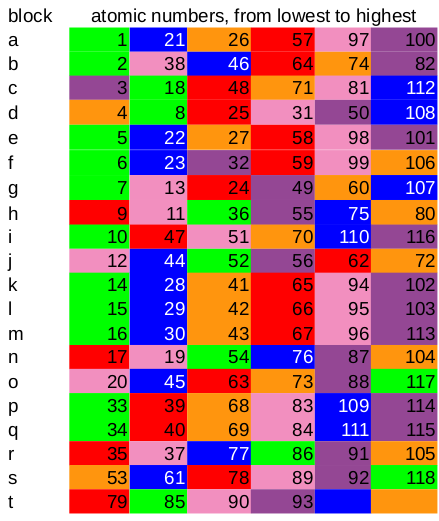
Each block was assigned as letter (“a” through “t”) for easy identification purposes; it was based on the order of the lowest number on each block, as shown in this table.
But how do we know that it was systematic at all? What if one were to just just choose any six numbers at random to put on a block together? This is like taking six samples from a uniform probability distribution. This distribution has a mean of 59.5 and a standard deviation is 34 — very close to the average of the Uncle Goose block set.
On the other hand, there was also that matter of how no block has any two consecutive numbers. We can do a rough calculation of the probability of that happening for a single block:
1 x 115/117 x 112/116 x 109/115 x 106/114 x 103/113 = 76%
Explanation:
- You can imagine it as having 118 different element stickers in a bag, and you are reaching in without looking and pulling out six, one at a time, and sticking them on the sides of a blank cube.
- First, you choose an element at random and put it on one side of your cube. (This is the “1” at the beginning of the line.)
- For the second draw, there are now 117 stickers in the bag. Two of these are adjacent to the first number that you pulled out (unless you happened to get atomic number 1 or 118 on your first draw, but we’ll neglect those for our rough calculation). So the likelihood that you choose a number that isn’t adjacent is 115/117.
- Similarly, the probability that the third element drawn isn’t adjacent to either of the first two is about 112 in 116, and so on.
Thus, if you’re randomly choosing 6 elements out of 118, there’s a 76% chance that none of those will have adjacent atomic numbers — or, equivalently, a 24% chance that they will.
In other words, if you repeated this experiment a bunch of times, you’d expect that about 1/4 of those times, you would end up with adjacent elements in your randomly chosen set of six. Given that there are 20 blocks, this means that having zero of those with adjacent elements is statistically suspicious.
Thus, although we can’t conclude that the block designer(s) made a deliberate effort to get a large spread of numbers on each block, it does look like they deliberately avoiding putting consecutive numbers on the same block.
Question 2: How are colors distributed within each set of six?
If you started off by choosing some way to distribute your 118 atomic numbers onto 20 blocks, the next question is how to assign colors to the different sides — again, assuming that you don’t know any chemistry. Of course, each side of the block needs to be a different color.
The simplest coloring scheme would be to color the numbers on each block consecutively. For example, the lowest number on each block could be green, the next lowest blue, then orange, red, pink and purple. Alternately, one could “rotate” the colors, so that each color is assigned to each “position” (i.e., lowest number on the block, second lowest, etc.) as evenly as possible.
The actual “matching” of colors to sequence of numbers is neither of these cases, as we can from this set of charts.
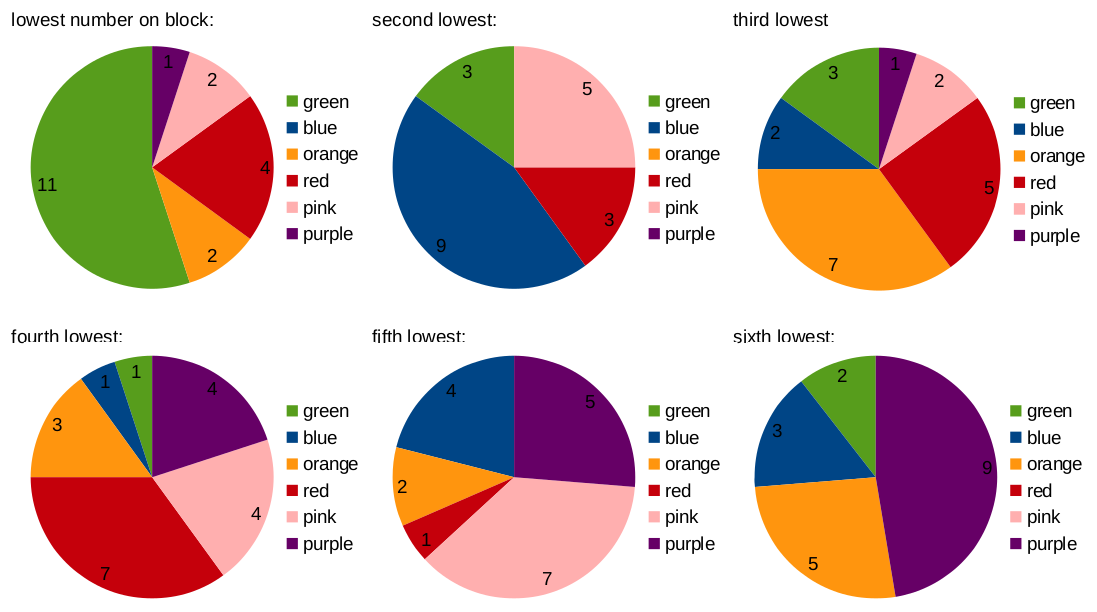
The top left chart shows what fraction of the blocks have their lowest-atomic-number what color, the chart in the bottom right shows what fraction of blocks have their highest-atomic-number element what color, and so on.
So we’re in between those two hypothetical scenarios. (In the first one each pie chart would be a different, single-colored circle; in the second one, each would have six approximately equal, different-colored slices). While you can make some generalizations, the take-away is probably that this consideration is probably tertiary. (Note that the three questions we’re considering are not independent from one another, due to the constraint that each side of a block needs to be a different color. For example, if numbers 1-20 are all green, then each must be on a different block. As a result, the lowest number on any given block will always be green, and the standard deviations of the blocks would be higher.)
Question 3: How are colors distributed over the periodic table as a whole?
Now, to get back to what, in my opinion, is the most interesting question!
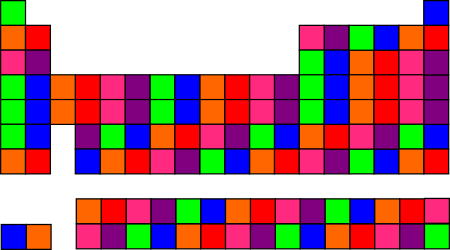
Qualitatively, we can ask whether the six different colors, distributed over the periodic table, are mixed up like confetti or separated out into blocks? Here are the two most simplistic systems:
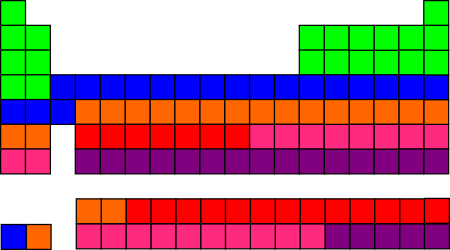
Making the first 20 elements green, then next 20 blue, etc. wasn’t actually quite as silly-looking as I had expected it would be.
If you cycle through the colors repeatedly, you get a “confetti” effect in some places and vertical blocks in others, because rows 4 and 5 of the table have 18 columns — an even multiple of 6.
If you like the “confetti” look, there are tons of different options. This is related to the topic of entropy; there are more different ways to have “mixed up” colors than there are to have grouped colors.
Personally, if I worked for Uncle Goose, designing the block set, I would try to make the color distribution as reminiscent as possible of the periodic table . . . and I think my result (as described on the main page of this entry) does a pretty good job!