
The second anniversary of finishing grad school seemed like an appropriate time to try to get this blog going again. This might go without saying, but writing a Ph.D. thesis* can really interfere with a person’s recreational science blogging. (Not that the time thereafter is necessarily much freer, at least not when starting a new job in a new sub-field, on a new continent, in a new country that speaks a different language . . . but that’s another matter.) Similarly, the topic of the Ph.D. thesis seemed like an appropriate one with which to start.
“How long will it take me to write my thesis?” is a question that every grad student must wonder at some point along the way — probably several points, in fact. I was wondering it just as I was starting** to write mine in February 2012, and I decided that strictly tracking the number of hours I invested in the project might both A.) be an interesting factoid, and B.) help me to better focus on the task.
Looking back at the data I’d taken and adding it up, the answer, it turned out, was approximately 283 hours — i.e., the equivalent of 11.8 24-hour days, 15.7 18-hour days, 23.6 12-hour days, or 35.4 8-hour days.
This is not to say that my thesis-writing took place in any of the above evenly-spaced distributions. At the beginning, I was writing in short spurts, often during evenings and weekends, trying to fit it in around lab work and other more immediate tasks. As the deadline for submitting to my committee neared, the percent of my time devoted to the thesis increased. In last few days, it consumed the vast majority of my waking hours, as I pressed to complete all the remaining “to do”s from the lists I had been continuously both generating and checking off the last few months.
Some of these trends can be seen by graphing the log of my hours, even though that wasn’t the original intent when I wrote them down. (At the time, I was simply trying to keep myself “honest” by writing down exactly when I started and finished each thesis-writing session, so as not to overcount what I had invested thus far.)
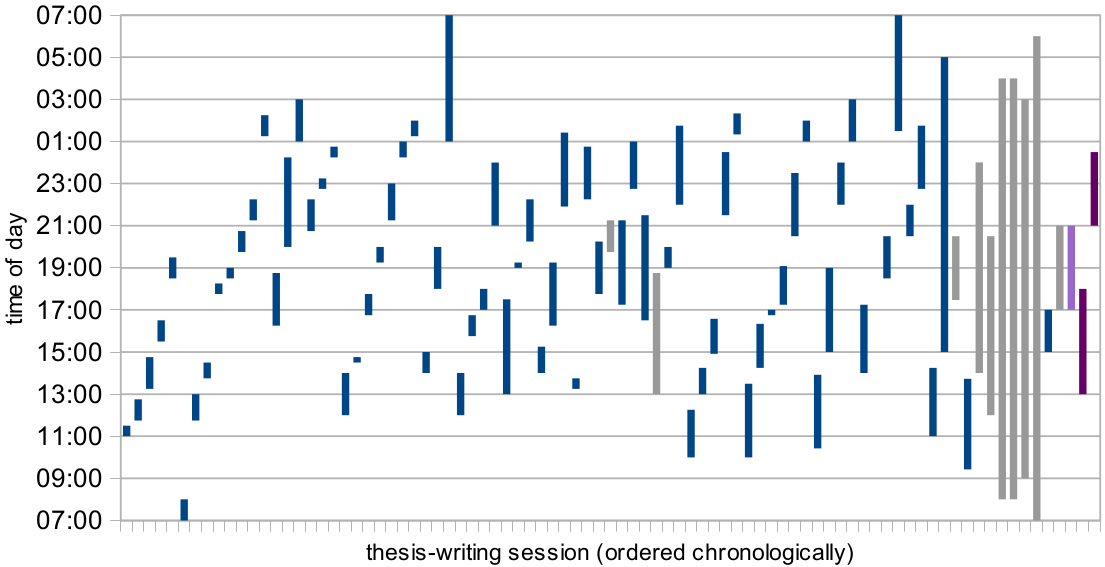 When I wrote my thesis. (Purple and light purple indicate sessions during the revision period — i.e., after it was submitted to my committee. Light purple and gray bars indicate that a total time was recorded — not counting time out for various breaks — but that precise start and stop times were not; in these cases, the start and stop times used for the graph were either estimated from other information about the day in question or just guessed.)
To be clear on the “rules” used: I only counted time spent actively working directly on the thesis. The clock was stopped for any and all breaks (be it for going to the bathroom, answering the phone, or checking e-mail). Writing or revising a paper didn’t count, regardless of whether I thought I’d be able to transfer the contents directly into my thesis. (In the end, I did very little of this, since the writing styles of the two were too different.) I also didn’t count time spent on unnecessary “bells and whistles” (e.g., selecting quotes with which to start each chapter, composing the acknowledgements, or playing around with LaTeX formatting unless it was to solve a serious problem).
I did count time spent on some data analysis, graph-making or -remaking, and derivations that were done specifically for the thesis. One could argue that these shouldn’t be included, because if I’d done them before starting to write up my thesis — say, as part of stand-alone reports or summaries — they wouldn’t have been a part of the tally. However, the process of writing, organizing, and unifying one’s work inevitably helps to illuminate gaps; some filling of these gaps seems like a legitimate part of the process. Time spent doing extra experiments, however, I deemed ineligible.
I’m hesitant to take a stab at guessing how much large the error bars should be, as I am not convinced it would be meaningful to do so. However, given that I’m pretty sure I forgot to write down an impromptu session or two here or there, coupled with how conscientious I was when I was writing down times, if anything the total probably a bit of an underestimate.
A few things perhaps worth noting about the above graph:
- Half of total time resides in just the right-hand 17 percent of discretely counted sessions (though this isn’t particularly meaningful, since the gray bars would have been broken into smaller sessions due to bathroom and snack and nap breaks, had I been tallying through to the end).
- Unfortunately, the x-axis cannot be translated into time. I simply don’t have the information to do that, since I wasn’t writing down the dates — only when I started and stopped (until the end, when I primarily added up the length of time I wasn’t working each day). Some consecutive sessions took place on the same day, while others were days apart.
- Clearly, when left to my own devices, I tend to be something of a night owl, since most of the work took place between 11 a.m. and 3 a.m. Similarly, I chose 7 a.m. for the limits of the y-axis because it was the only time of day that no block of time crossed.
- The mad dash at the end is not an exaggeration. That was an intense week, in which I totaled 8.5 hours of sleep over five days; I am still amazed that this worked as well as it did. (Contrary to one might expect, the content added during this period did not seem to contain a higher rate of typos/errors, nor any rambling accounts of sleep-deprivation-induced hallucinations.)
For the record, I should probably note that I do not, in fact, recommend the “mad dash at the end” approach; it was quite stressful and surely isn’t healthy. I can’t imagine that it’s inevitable, either. There must be people out there who have put the finishing touches on their theses in a leisurely manner, several days before their respective deadlines for submission to their respective committees. However, research tends to raise questions at least as fast as it answers them, so it’s very easy to find one more supplemental analysis to check out, simulation to run, experiment to try, or calculation to do. And in the event that all of that is neatly and completely wrapped up, with no loose ends, there is still the danger of thoughts like, “Wouldn’t it look so much nicer and more professional, if only all graphs were SVGs with precisely uniform grid lines and font sizes and styles . . .”
On a related note, one might next ask, “How does time spent translate into how much thesis has been written?” Clearly, there isn’t a single function relating the two. Sometimes, I would write what struck me as the minimum elaboration needed for a particular figure or claim and all of a sudden have five more pages’ worth. Other times, several hours of work went into a single half page of content, be it graphical or written. Earlier in the process, working out how best to organize things could be quite the time sink, while later, there was a lot of fine-tuning to do.
Although, as previously mentioned, I wasn’t tracking time per day, I did keep some records of how long my thesis was, starting around the time it got down to the last three weeks or so (i.e., after I started to worry that it would never reach an acceptable length):
 The relative scale of the two y-axes was chosen, for aesthetic reasons, to make the two data points at “time = 0” coincide). After submission, the two main contributions to the increase in length were the expansion of an appendix and addition of acknowledgments.
Turns out that (for the time period in question):
- Up until the last three days, I averaged about 2.5 pages/day.
- Words and pages tracked one another fairly closely — more so than I expected.
- The average words/page did increase over time, though, from 273 (when I first started keeping track of both figures) to 283.
- Approximately half of the total volume was added in the last 10 days.
- After the big push with two to three days to go, the curve started to plateau again, even though this was during the period of fairly continuous work. (I interpret this to mean that in the end, it was indeed approaching a more finely polished state.)
Finally, there’s one very crucial piece of information that the laboring Ph.D. candidate needs to know: “When will my thesis be long enough to be ‘done’?” When I was writing, I looked up the theses of other students in my group, in order to get a sense of what to aim for. Later, just out of curiosity, I looked up the theses of other Caltech Ph.D.s (nearly all written within a few years of mine) to see how my group’s compared to those in other groups and even other departments. I used two different metrics: pages of content (chapters + appendices) and total word count in the document.
 The two purple points represent my thesis, as it stood when I submitted it to my committee (“done”) and when I submitted the edited/corrected version to the library (“final”). The red points are other theses from my group, while the blue ones are other theses from Caltech at large. The dashed line is the best linear fit for the total group of points.
Roughly speaking, it would appear that the 30,000- to 40,000-word range and 100- to 150-page range is a pretty popular place to be. That said, there is quite the spread. There are clearly theses with about 50 percent more words than others that have approximately the same number of pages, as well as those with 50 percent more pages than others that have approximately the same number of words.
Why so much variation? Well, there are several competing effects that could move a given thesis’s data point on that graph up or down, left or right, or closer or farther from the origin (i.e., shorten/lengthen it with respect to both metrics):
length in general: Some theses re-present results that were originally someone else’s work, include pages of computer code, offer extended reviews of the field, or detail the precise parameters used for each experiment. Clearly, all of these would make one’s thesis longer, both in terms of pages and words. Some of them might be quick infusions (e.g., dropping in pre-existing material), while others might be very time-consuming (e.g., re-deriving a proof).
In general, there are very different philosophies out there regarding what a thesis ought to contain. Is it meant to be a detailed “how to” manual for someone who might want to reproduce your work? Or is basically a collection of already-published papers that have been assembled together with little modification, so as to meet the institution’s fairly archaic requirements for earning the degree? How you feel about these questions — as well as how your advisor and committee members feel — will have a significant effect on the total amount of content that goes into your thesis. So might, say, the quickly-closing deadline for graduation or the start date for your next job.
x-axis: As anyone who has ever been assigned an n-page essay knows, page count is non-trivially dependent on font size and line spacing. Font style and margin width are also well-known variables, but it might look a bit silly in this day and age to submit a thesis in Courier New, and margins are explicitly specified by the Caltech thesis regulations. Font size simply needs to be “10 point or larger, because the manuscript will be reduced in size on microfilm”. (On second thought, perhaps Courier New would be appropriate after all . . . ) In practice, 11-, 11.5-, and 12-point type all seemed to be commonly used options. Technically, the regulations do call for double-spacing, but 1.5-spacing is also accepted — and, in fact, is the default for the LaTeX document class.
Putting in a larger number of figures, tables, and charts also inflates page counts for a given word count. With a finite amount of time, though, this isn’t a good strategy for racking up the pages (as these items can also take quite a bit of time and effort to make). Hence, theses located farther to the right on the graph — i.e., those with a lower density of words per page — might owe that to being full of carefully-crafted, painstakingly-made illustrations . . . or to using a larger font and double-spacing. The graph above doesn’t distinguish.
y-axis: Word counts, meanwhile, may be boosted by chapter-length acknowledgements and fully-detailed references (i.e., including the titles of papers, writing out the full names of the journals, and listing all of the authors). A third, more subtle factor, is whether the labels on one’s graphs are in text rather than vector or bitmap formats.
The y-intercept of the linear fit represents the average number of “words” are contained in all the pages I didn’t count as content (e.g., cover page, abstract, acknowledgements, table of contents, lists of figures and tables, and bibliography). I used the quotation marks around “words” because your basic word-counting script doesn’t distinguish between, say, “magnetohydrodynamics” and any given “.” in the table of contents or list of figures. As a result, despite a few of the non-content pages being pretty sparse, the others more than make up for it, and the average thesis has approximately 9200 “words” outside its chapters and appendices, thereby representing a significant fraction of the document’s total word count. Curious as to whether this estimate from the linear fit really panned out, I checked it against my thesis, and it’s quite close: my non-content pages yielded a little over 8500 words.
So there you have it: a bit more information about what went into one particular applied physics Ph.D. thesis — which, in the end, turned out to be pretty average. (That said, I both was and still am rather personally satisfied with the results.)
——-
* As a certain uncle of mine likes to point out whenever he gets the chance, it is technically a dissertation. At Caltech, however, “thesis” is the accepted colloquial designation.
** This was actually the second time I was “starting to write.” I had had a document entitled “thesis” for a good year before that, but it never really took shape and I ended up starting anew.